Dataframes

The pandas package makes it easy to work with CSV formatted data, by providing us with two new datatypes, called the DataFrame and the Series. This guide will walk you through common and practical ways of working with these objects.

1) Obtaining DataFrames

The pandas package provides a datatype called the DataFrame, which represents tabular, spreadsheet-style data with rows and columns.

The DataFrame Class Constructor

If we have some data in an eligible format (list of lists, list of dictionaries, dictionary of lists), we can pass it to the DataFrame class constructor to obtain a dataframe object.

From a List of Lists

Constructing a DataFrame from a list of lists:

from pandas import DataFrame

# lesser used format (list of lists)
prices = [
    ["2020-10-01", 100.00],
    ["2020-10-02", 101.01],
    ["2020-10-03", 120.20],
    ["2020-10-04", 107.07],
    ["2020-10-05", 142.42],
    ["2020-10-06", 135.35],
    ["2020-10-07", 160.60],
    ["2020-10-08", 162.62],
]

df = DataFrame(prices, columns=["date","stock_price_usd"])
df.head()
date stock_price_usd
0 2020-10-01 100.00
1 2020-10-02 101.01
2 2020-10-03 120.20
3 2020-10-04 107.07
4 2020-10-05 142.42

Because the lists don’t have column names, we supply those separately, using the columns parameter.

From a List of Dictionaries

Constructing a DataFrame from a list of dictionaries (i.e. “records” format):

from pandas import DataFrame

# common "records" format (list of dicts)
prices = [
    {"date": "2020-10-01", "stock_price_usd": 100.00},
    {"date": "2020-10-02", "stock_price_usd": 101.01},
    {"date": "2020-10-03", "stock_price_usd": 120.20},
    {"date": "2020-10-04", "stock_price_usd": 107.07},
    {"date": "2020-10-05", "stock_price_usd": 142.42},
    {"date": "2020-10-06", "stock_price_usd": 135.35},
    {"date": "2020-10-07", "stock_price_usd": 160.60},
    {"date": "2020-10-08", "stock_price_usd": 162.62},
]

df = DataFrame(prices)
df.head()
date stock_price_usd
0 2020-10-01 100.00
1 2020-10-02 101.01
2 2020-10-03 120.20
3 2020-10-04 107.07
4 2020-10-05 142.42

In this case, each dictionary in the list has certain keys, which will show up as the corresponding columns in the dataframe.

From a Dictionary of Lists

Constructing a DataFrame from a dictionary of lists:

from pandas import DataFrame

# lesser used format (dict of lists)
prices = {
    "date": [
        "2020-10-01", "2020-10-02", "2020-10-03", "2020-10-04",
        "2020-10-05", "2020-10-06", "2020-10-07", "2020-10-08"
    ],
    "stock_price_usd": [
        100.00, 101.01, 120.20, 107.07,
        142.42, 135.35, 160.60, 162.62
    ]
}
df = DataFrame(prices)
df.head()
date stock_price_usd
0 2020-10-01 100.00
1 2020-10-02 101.01
2 2020-10-03 120.20
3 2020-10-04 107.07
4 2020-10-05 142.42

The dictionary’s keys correspond with the column names, and the dictionary’s values correspond with the values for each column.

The read_csv Function

If we have data in CSV format, we can leverage the read_csv function to convert that data into a dataframe object.

Note

if we have an XLS or XLSX file, we can alternatively use the read_excel function.

Reading Local CSV Files

We can read local CSV files.

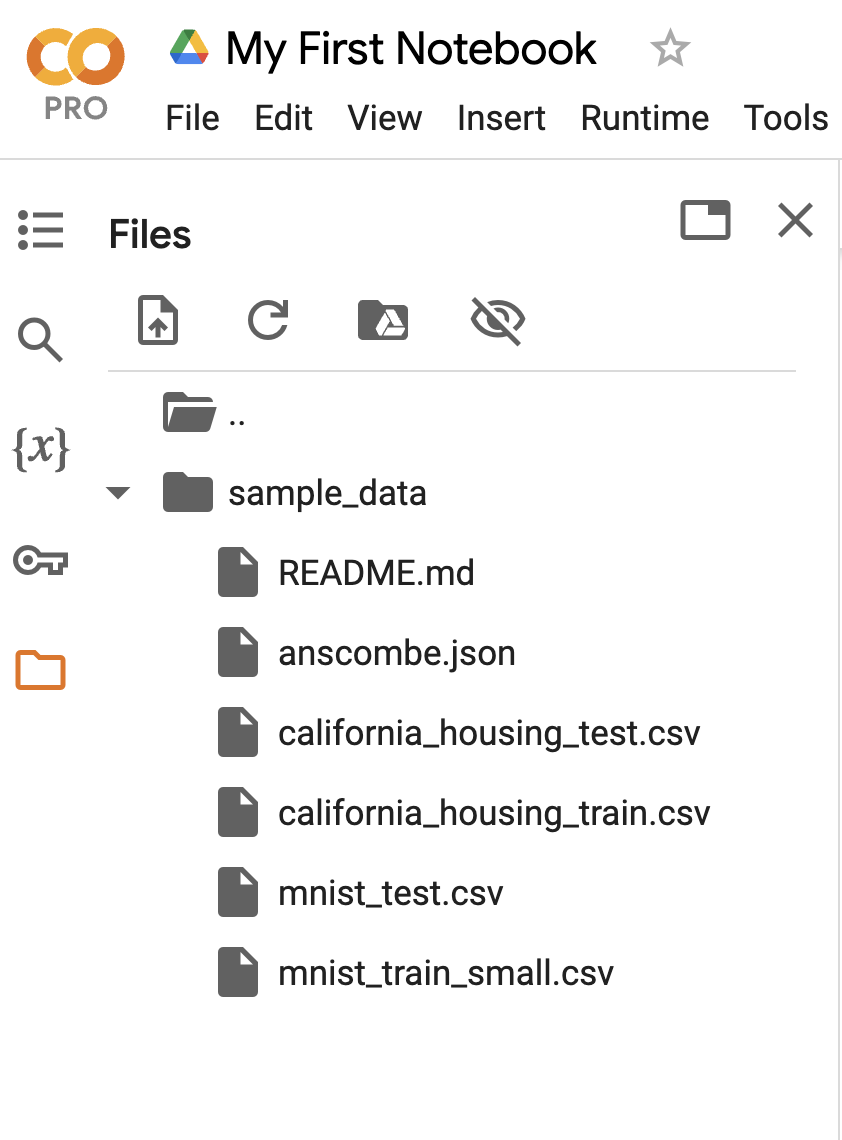
For example there is a CSV file in the Colab Filesystem called “california_housing_train.csv” in the “sample_data” directory.

Example CSV file in the Colab Filesystem

To read this file, we pass the filepath to the read_csv function:

from pandas import read_csv

csv_filepath = "sample_data/california_housing_train.csv"
housing_df = read_csv(csv_filepath)
housing_df.head()
longitude latitude housing_median_age total_rooms total_bedrooms population households median_income median_house_value
0 -114.31 34.19 15.0 5612.0 1283.0 1015.0 472.0 1.4936 66900.0
1 -114.47 34.40 19.0 7650.0 1901.0 1129.0 463.0 1.8200 80100.0
2 -114.56 33.69 17.0 720.0 174.0 333.0 117.0 1.6509 85700.0
3 -114.57 33.64 14.0 1501.0 337.0 515.0 226.0 3.1917 73400.0
4 -114.57 33.57 20.0 1454.0 326.0 624.0 262.0 1.9250 65500.0

Note, we can upload our own CSV files to the Colab Filesystem as well.

# upload your CSV file into the colab notebook filesystem, and note it's name (like "example.csv")

#csv_filepath = "example.csv"

#my_df = read_csv(csv_filepath)
#my_df.head()

Reading Hosted CSV Files

We can also read CSV formatted data hosted on the Internet (as we’ve seen in a past lesson).

We note the URL of the hosted file, and pass it to the read_csv function:

from pandas import read_csv

repo_url = "https://raw.githubusercontent.com/prof-rossetti/intro-to-python"
request_url = f"{repo_url}/main/data/daily_adjusted_nflx.csv"
prices_df = read_csv(request_url)
prices_df.head()
timestamp open high low close adjusted_close volume dividend_amount split_coefficient
0 2021-10-18 632.1000 638.4100 620.5901 637.97 637.97 4669071 0.0 1.0
1 2021-10-15 638.0000 639.4200 625.1600 628.29 628.29 4116874 0.0 1.0
2 2021-10-14 632.2300 636.8800 626.7900 633.80 633.80 2672535 0.0 1.0
3 2021-10-13 632.1791 632.1791 622.1000 629.76 629.76 2424638 0.0 1.0
4 2021-10-12 633.0200 637.6550 621.9900 624.94 624.94 3227349 0.0 1.0

Whether we are reading a local or hosted CSV file, after using the read_csv function, we obtain a dataframe object back.

2) Working with DataFrames

Now that we have obtained a dataframe, let’s start working with it.

Let’s consider this dataframe of stock prices.

Inspecting the Data

We can inspect the first few rows, or the last few rows, using the head method, or tail method, respectively:

prices_df.head()
timestamp open high low close adjusted_close volume dividend_amount split_coefficient
0 2021-10-18 632.1000 638.4100 620.5901 637.97 637.97 4669071 0.0 1.0
1 2021-10-15 638.0000 639.4200 625.1600 628.29 628.29 4116874 0.0 1.0
2 2021-10-14 632.2300 636.8800 626.7900 633.80 633.80 2672535 0.0 1.0
3 2021-10-13 632.1791 632.1791 622.1000 629.76 629.76 2424638 0.0 1.0
4 2021-10-12 633.0200 637.6550 621.9900 624.94 624.94 3227349 0.0 1.0
prices_df.tail()
timestamp open high low close adjusted_close volume dividend_amount split_coefficient
95 2021-06-03 495.19 496.66 487.2500 489.43 489.43 3887445 0.0 1.0
96 2021-06-02 499.82 503.22 495.8200 499.24 499.24 2268979 0.0 1.0
97 2021-06-01 504.01 505.41 497.7443 499.08 499.08 2482555 0.0 1.0
98 2021-05-28 504.40 511.76 502.5300 502.81 502.81 2911297 0.0 1.0
99 2021-05-27 501.80 505.10 498.5400 503.86 503.86 3253773 0.0 1.0

By default, we see five rows, but we can customize the number of rows by passing an integer parameter to these methods, like head(3).

Counting number of rows, by passing the dataframe to the familiar len function:

len(prices_df) #> int of n_rows
100

Dataset shape (rows and columns):

prices_df.shape #> tuple of (n_rows, n_cols)
(100, 9)

Using the shape property is especially helpful when working with multidimensional data (i.e. data in three or more dimensions).

Identifying column names, using the columns property:

prices_df.columns

# prices_df.columns.tolist() # as a list datatype
Index(['timestamp', 'open', 'high', 'low', 'close', 'adjusted_close', 'volume',
       'dividend_amount', 'split_coefficient'],
      dtype='object')

Be aware, every dataframe has an index (or set of unique row identifiers). By default the index is a set of auto-incrementing numbers starting at 0.

print(prices_df.index)
RangeIndex(start=0, stop=100, step=1)

Accessing Columns

We can access one or more columns worth of values, using a dictionary-like accessor.

When we access a single column (using a string column name), we get a pandas Series object:

closing_prices = prices_df["adjusted_close"]
print(type(closing_prices)) #> Series

closing_prices.head()
<class 'pandas.core.series.Series'>
0    637.97
1    628.29
2    633.80
3    629.76
4    624.94
Name: adjusted_close, dtype: float64

When we access multiple columns (using a list of column names), we get a DataFrame object back:

closing_prices = prices_df[["timestamp", "adjusted_close", "volume"]]
print(type(closing_prices)) #> DataFrame

closing_prices.head()
<class 'pandas.core.frame.DataFrame'>
timestamp adjusted_close volume
0 2021-10-18 637.97 4669071
1 2021-10-15 628.29 4116874
2 2021-10-14 633.80 2672535
3 2021-10-13 629.76 2424638
4 2021-10-12 624.94 3227349

Accessing Rows

We use a list-like accessor approach to reference a given row, using the iloc method.

When we access a single row, we get a Series object. In this example, we are accessing the first row, using an index value of 0:

latest = prices_df.iloc[0]
print(type(latest)) #> Series

latest
<class 'pandas.core.series.Series'>
timestamp            2021-10-18
open                      632.1
high                     638.41
low                    620.5901
close                    637.97
adjusted_close           637.97
volume                  4669071
dividend_amount             0.0
split_coefficient           1.0
Name: 0, dtype: object

When we access multiple rows, we get a DataFrame object. In this example, we are accessing the first three rows, using a slicing approach:

latest_few = prices_df.iloc[0:3]
print(type(latest_few)) #> DataFrame

latest_few
<class 'pandas.core.frame.DataFrame'>
timestamp open high low close adjusted_close volume dividend_amount split_coefficient
0 2021-10-18 632.10 638.41 620.5901 637.97 637.97 4669071 0.0 1.0
1 2021-10-15 638.00 639.42 625.1600 628.29 628.29 4116874 0.0 1.0
2 2021-10-14 632.23 636.88 626.7900 633.80 633.80 2672535 0.0 1.0
Note

When we use index references, we are actually referencing the index value itself (which by default is an auto-incrementing integer starting at zero).But its possible for us the change the index (for example the date). So if you change your index later, you may need to use the new index values (dates instead of the default integers).

Iteration / Looping through Rows

We can loop through each row using the iterrows method, involving a destructuring approach to reference the row index (i) as well as the row’s values (row).

In this example, we are looping through just the first three rows, for simplicity:

for i, row in prices_df.head(3).iterrows():
    print("------------")
    print("INDEX:", i)
    print(type(row))
    print(row)
    #print(row["timestamp"])
------------
INDEX: 0
<class 'pandas.core.series.Series'>
timestamp            2021-10-18
open                      632.1
high                     638.41
low                    620.5901
close                    637.97
adjusted_close           637.97
volume                  4669071
dividend_amount             0.0
split_coefficient           1.0
Name: 0, dtype: object
------------
INDEX: 1
<class 'pandas.core.series.Series'>
timestamp            2021-10-15
open                      638.0
high                     639.42
low                      625.16
close                    628.29
adjusted_close           628.29
volume                  4116874
dividend_amount             0.0
split_coefficient           1.0
Name: 1, dtype: object
------------
INDEX: 2
<class 'pandas.core.series.Series'>
timestamp            2021-10-14
open                     632.23
high                     636.88
low                      626.79
close                     633.8
adjusted_close            633.8
volume                  2672535
dividend_amount             0.0
split_coefficient           1.0
Name: 2, dtype: object

When we reference a given row in this approach, we are dealing with a Series object.

Sorting Rows

We can use the DataFrame’s sort_values method to sort rows on the basis of one or more given columns.

By default, sort_values is not mutating, but as of the current version of pandas, we can use the inplace parameter to perform a mutating sort:

# can store back in same variable to overwrite:
# prices_df = prices_df.sort_values(by="timestamp", ascending=True)

# or alternatively use inplace=True parameter to perform a MUTATING operations
prices_df.sort_values(by="timestamp", ascending=True, inplace=True)
prices_df.head()
timestamp open high low close adjusted_close volume dividend_amount split_coefficient
99 2021-05-27 501.80 505.10 498.5400 503.86 503.86 3253773 0.0 1.0
98 2021-05-28 504.40 511.76 502.5300 502.81 502.81 2911297 0.0 1.0
97 2021-06-01 504.01 505.41 497.7443 499.08 499.08 2482555 0.0 1.0
96 2021-06-02 499.82 503.22 495.8200 499.24 499.24 2268979 0.0 1.0
95 2021-06-03 495.19 496.66 487.2500 489.43 489.43 3887445 0.0 1.0

We can use the ascending parameter to reverse the sort order:

prices_df.sort_values(by="timestamp", ascending=False, inplace=True)
prices_df.head()
timestamp open high low close adjusted_close volume dividend_amount split_coefficient
0 2021-10-18 632.1000 638.4100 620.5901 637.97 637.97 4669071 0.0 1.0
1 2021-10-15 638.0000 639.4200 625.1600 628.29 628.29 4116874 0.0 1.0
2 2021-10-14 632.2300 636.8800 626.7900 633.80 633.80 2672535 0.0 1.0
3 2021-10-13 632.1791 632.1791 622.1000 629.76 629.76 2424638 0.0 1.0
4 2021-10-12 633.0200 637.6550 621.9900 624.94 624.94 3227349 0.0 1.0
FYI

The inplace parameter may be deprecated in a future version of pandas, in which case we would have to store the sorted values back in another variable (similar to the approach for sorting lists using the sorted function).

Filtering Rows

We can filter a DataFrame to get only the rows that match some given condition.

We first specify a “mask” condition that determines for each row, whether it meet the criteria or not (True vs False).

# this is the mask:
prices_df["timestamp"] == "2021-10-15"
0     False
1      True
2     False
3     False
4     False
      ...  
95    False
96    False
97    False
98    False
99    False
Name: timestamp, Length: 100, dtype: bool

Then we pass this mask into a dataframe object accessor, to give us only the rows that meet the given condition.

Filtering based on equality, using familiar == operator:

prices_df[  prices_df["timestamp"] == "2021-10-15" ]
timestamp open high low close adjusted_close volume dividend_amount split_coefficient
1 2021-10-15 638.0 639.42 625.16 628.29 628.29 4116874 0.0 1.0

Filtering based on numeric comparisons:

prices_df[  prices_df["timestamp"] >= "2021-10-12" ]
timestamp open high low close adjusted_close volume dividend_amount split_coefficient
0 2021-10-18 632.1000 638.4100 620.5901 637.97 637.97 4669071 0.0 1.0
1 2021-10-15 638.0000 639.4200 625.1600 628.29 628.29 4116874 0.0 1.0
2 2021-10-14 632.2300 636.8800 626.7900 633.80 633.80 2672535 0.0 1.0
3 2021-10-13 632.1791 632.1791 622.1000 629.76 629.76 2424638 0.0 1.0
4 2021-10-12 633.0200 637.6550 621.9900 624.94 624.94 3227349 0.0 1.0

Filtering based on values between lower and upper bound, using between method:

prices_df[  prices_df["timestamp"].between("2021-10-01", "2021-11-01") ]
timestamp open high low close adjusted_close volume dividend_amount split_coefficient
0 2021-10-18 632.1000 638.4100 620.5901 637.97 637.97 4669071 0.0 1.0
1 2021-10-15 638.0000 639.4200 625.1600 628.29 628.29 4116874 0.0 1.0
2 2021-10-14 632.2300 636.8800 626.7900 633.80 633.80 2672535 0.0 1.0
3 2021-10-13 632.1791 632.1791 622.1000 629.76 629.76 2424638 0.0 1.0
4 2021-10-12 633.0200 637.6550 621.9900 624.94 624.94 3227349 0.0 1.0
5 2021-10-11 633.1950 639.4200 626.7800 627.04 627.04 2862470 0.0 1.0
6 2021-10-08 634.1650 643.8000 630.8600 632.66 632.66 3272093 0.0 1.0
7 2021-10-07 642.2252 646.8400 630.4500 631.85 631.85 3556886 0.0 1.0
8 2021-10-06 628.1800 639.8699 626.3600 639.10 639.10 4580434 0.0 1.0
9 2021-10-05 606.9400 640.3900 606.8900 634.81 634.81 9534293 0.0 1.0
10 2021-10-04 613.3900 626.1250 594.6800 603.35 603.35 4995932 0.0 1.0
11 2021-10-01 604.2400 614.9900 597.5050 613.15 613.15 4090847 0.0 1.0

Filtering based on inclusion, using isin method:

dates_of_interest = ["2021-10-15", "2021-10-14", "2021-10-12"]

prices_df[  prices_df["timestamp"].isin(dates_of_interest) ]
timestamp open high low close adjusted_close volume dividend_amount split_coefficient
1 2021-10-15 638.00 639.420 625.16 628.29 628.29 4116874 0.0 1.0
2 2021-10-14 632.23 636.880 626.79 633.80 633.80 2672535 0.0 1.0
4 2021-10-12 633.02 637.655 621.99 624.94 624.94 3227349 0.0 1.0

Filtering on substring match, using str.contains method:

prices_df[  prices_df["timestamp"].str.contains("2021-10-1") ]
timestamp open high low close adjusted_close volume dividend_amount split_coefficient
0 2021-10-18 632.1000 638.4100 620.5901 637.97 637.97 4669071 0.0 1.0
1 2021-10-15 638.0000 639.4200 625.1600 628.29 628.29 4116874 0.0 1.0
2 2021-10-14 632.2300 636.8800 626.7900 633.80 633.80 2672535 0.0 1.0
3 2021-10-13 632.1791 632.1791 622.1000 629.76 629.76 2424638 0.0 1.0
4 2021-10-12 633.0200 637.6550 621.9900 624.94 624.94 3227349 0.0 1.0
5 2021-10-11 633.1950 639.4200 626.7800 627.04 627.04 2862470 0.0 1.0

Saving Data to CSV File

We can use the to_csv method to export a DataFrame to a CSV file. When we do this, we specify as a parameter the name of the CSV file that should be created:

# run this cell then check the colab notebook filesystem, where you can see the file and download it
prices_df.to_csv("prices_export.csv", index=False)

When saving files in Colab, the file will be saved to the Colab Filesystem, where we have the ability to download the file to our local machine.

3) Working with Series

Let’s return to focus on the Series datatype in more detail.

Column as Series

When we access a given column of values, we have a Series object:

closing_prices = prices_df["adjusted_close"]

print(type(closing_prices))
print(closing_prices)
<class 'pandas.core.series.Series'>
0     637.97
1     628.29
2     633.80
3     629.76
4     624.94
       ...  
95    489.43
96    499.24
97    499.08
98    502.81
99    503.86
Name: adjusted_close, Length: 100, dtype: float64

With a column as a Series, we can use list-like accessors, and we can convert it to a list of values as desired:

closing_prices[0]
637.97
print(closing_prices.tolist())
[637.97, 628.29, 633.8, 629.76, 624.94, 627.04, 632.66, 631.85, 639.1, 634.81, 603.35, 613.15, 610.34, 599.06, 583.85, 592.64, 592.39, 593.26, 590.65, 573.14, 575.43, 589.35, 586.5, 582.87, 577.76, 589.29, 598.72, 597.54, 606.05, 606.71, 590.53, 588.55, 582.07, 569.19, 566.18, 558.92, 550.12, 547.58, 553.41, 553.33, 546.88, 543.71, 521.87, 518.91, 517.92, 515.92, 510.72, 512.4, 515.84, 519.97, 520.55, 524.89, 517.35, 510.82, 515.15, 517.57, 514.25, 519.3, 518.91, 516.49, 515.41, 511.77, 513.63, 531.05, 532.28, 530.31, 542.95, 547.95, 540.68, 537.31, 535.98, 530.76, 535.96, 541.64, 533.98, 533.54, 528.21, 533.5, 533.03, 527.07, 518.06, 512.74, 508.82, 497.0, 500.77, 498.34, 492.41, 491.9, 499.89, 488.77, 487.27, 485.81, 492.39, 494.66, 494.74, 489.43, 499.24, 499.08, 502.81, 503.86]
Row as Series

When we access a given row of values, we have a Series object as well:

latest = prices_df.iloc[0]
print(type(latest))
print(latest)
<class 'pandas.core.series.Series'>
timestamp            2021-10-18
open                      632.1
high                     638.41
low                    620.5901
close                    637.97
adjusted_close           637.97
volume                  4669071
dividend_amount             0.0
split_coefficient           1.0
Name: 0, dtype: object

With a row as a Series, we can use dictionary-like accessors, and can convert it to a dictionary as desired:

latest["close"]
637.97
latest.to_dict()
{'timestamp': '2021-10-18',
 'open': 632.1,
 'high': 638.41,
 'low': 620.5901,
 'close': 637.97,
 'adjusted_close': 637.97,
 'volume': 4669071,
 'dividend_amount': 0.0,
 'split_coefficient': 1.0}

Value Counts

We can use the value_counts method to count the number of times each value appears in the series.

prices_df["dividend_amount"].value_counts()
dividend_amount
0.0    100
Name: count, dtype: int64
prices_df["adjusted_close"].value_counts()
adjusted_close
518.91    2
637.97    1
531.05    1
541.64    1
535.96    1
         ..
590.53    1
606.71    1
606.05    1
597.54    1
503.86    1
Name: count, Length: 99, dtype: int64

We can use the normalize parameter to display our counts as percentage of the total number of rows:

prices_df["dividend_amount"].value_counts(normalize=True)
dividend_amount
0.0    1.0
Name: proportion, dtype: float64
prices_df["adjusted_close"].value_counts(normalize=True)
adjusted_close
518.91    0.02
637.97    0.01
531.05    0.01
541.64    0.01
535.96    0.01
          ... 
590.53    0.01
606.71    0.01
606.05    0.01
597.54    0.01
503.86    0.01
Name: proportion, Length: 99, dtype: float64

Series Aggregations

Consult the pandas Series docs for a comprehensive list of methods, including these aggregation methods:

prices_df["adjusted_close"].min()
485.81
prices_df["adjusted_close"].max()
639.1
prices_df["adjusted_close"].mean()
548.3657
prices_df["adjusted_close"].median()
533.76

4) Manipulating DataFrames

Let’s zoom back out to the DataFrame level, and learn how to manipulate or change them.

Creating New Columns

We can create a new column by specifying the name of that column and assigning a new value. For example, a column of constants:

prices_df["my_constant"] = 5
prices_df["my_constant"]
0     5
1     5
2     5
3     5
4     5
     ..
95    5
96    5
97    5
98    5
99    5
Name: my_constant, Length: 100, dtype: int64

In practice, instead of creating a new column of constants, we will generall use an entire new column or list of values, and assign those to the new column (see “Mapping Columns” section below).

Renaming Columns

We can use the rename method to rename columns. This is not mutating unless we use the inplace parameter.

prices_df.rename(columns={"my_constant":"renamed_constant"}, inplace=True)
prices_df["renamed_constant"]
0     5
1     5
2     5
3     5
4     5
     ..
95    5
96    5
97    5
98    5
99    5
Name: renamed_constant, Length: 100, dtype: int64

Dropping Columns

We can use the drop method to remove columns from the dataset. This is not mutating unless we use the inplace parameter.

prices_df.drop(columns=["renamed_constant"], inplace=True)
prices_df.head()
timestamp open high low close adjusted_close volume dividend_amount split_coefficient
0 2021-10-18 632.1000 638.4100 620.5901 637.97 637.97 4669071 0.0 1.0
1 2021-10-15 638.0000 639.4200 625.1600 628.29 628.29 4116874 0.0 1.0
2 2021-10-14 632.2300 636.8800 626.7900 633.80 633.80 2672535 0.0 1.0
3 2021-10-13 632.1791 632.1791 622.1000 629.76 629.76 2424638 0.0 1.0
4 2021-10-12 633.0200 637.6550 621.9900 624.94 624.94 3227349 0.0 1.0

Resetting the Index

Every DataFrame has a default index values, but we can set our own.

We might do this in practice when one of the columns in the dataset contains values which uniquely identify each row in the dataset.

# assuming our timestamp values are unique, we could use them as the index:
#prices_df.index = prices_df["timestamp"]

#prices_df.head()
# creating a copy of our dataset, so we don't change the original:
prices_copy = prices_df.copy()

# set new index
# assuming our "timestamp" values are unique, we could use them as the index:
prices_copy.index = prices_copy["timestamp"]
prices_copy.head()
timestamp open high low close adjusted_close volume dividend_amount split_coefficient
timestamp
2021-10-18 2021-10-18 632.1000 638.4100 620.5901 637.97 637.97 4669071 0.0 1.0
2021-10-15 2021-10-15 638.0000 639.4200 625.1600 628.29 628.29 4116874 0.0 1.0
2021-10-14 2021-10-14 632.2300 636.8800 626.7900 633.80 633.80 2672535 0.0 1.0
2021-10-13 2021-10-13 632.1791 632.1791 622.1000 629.76 629.76 2424638 0.0 1.0
2021-10-12 2021-10-12 633.0200 637.6550 621.9900 624.94 624.94 3227349 0.0 1.0

Mapping Columns

We can create mapped / transformed versions of the original columns, and store them back in the dataframe in a new column.

When we perform an operation with a scalar (single value), we perform that operation on each item in the Series, in this case, multiplying each value by 100:

prices_df["volume"] * 100
0     466907100
1     411687400
2     267253500
3     242463800
4     322734900
        ...    
95    388744500
96    226897900
97    248255500
98    291129700
99    325377300
Name: volume, Length: 100, dtype: int64
#prices_df["timestamp"] + " 12:00:00"

When we perform operations with two series, this performs an element-wise operation where the first values in each series are compared, then the second values, etc.

This essentially allows us to access and compare multiple values from the same row:

# mapped Series of values:
prices_df["close"] - prices_df["open"]
0     5.8700
1    -9.7100
2     1.5700
3    -2.4191
4    -8.0800
       ...  
95   -5.7600
96   -0.5800
97   -4.9300
98   -1.5900
99    2.0600
Length: 100, dtype: float64
# storing back in a new column:
prices_df["daily_change"] = prices_df["close"] - prices_df["open"]

prices_df[["timestamp", "open", "close", "daily_change"]].head()
timestamp open close daily_change
0 2021-10-18 632.1000 637.97 5.8700
1 2021-10-15 638.0000 628.29 -9.7100
2 2021-10-14 632.2300 633.80 1.5700
3 2021-10-13 632.1791 629.76 -2.4191
4 2021-10-12 633.0200 624.94 -8.0800

Applying a Transformation Function

For more complex logic, we can use the apply method to apply a transformation function.

We define our own transformation function which accepts a single parameter representing one of the values in the original series we are applying the transformation over, and return the transformed value.

Then we pass that transformation function as a parameter to the apply method:

# transformation function:

def buy_sell_recommendation(adjusted_closing_price):
    if adjusted_closing_price < 630:
        return "BUY"
    else:
        return "SELL"

assert buy_sell_recommendation(629.9) == "BUY"
assert buy_sell_recommendation(630.1) == "SELL"
prices_df["recommendation"] = prices_df["adjusted_close"].apply(buy_sell_recommendation)

prices_df[[ "adjusted_close", "recommendation"]].head()
adjusted_close recommendation
0 637.97 SELL
1 628.29 BUY
2 633.80 SELL
3 629.76 BUY
4 624.94 BUY

Converting Dates and Times

When we are working with date and time related values, it is possible to write our own conversion functions, like the examples below:

# transformation function:

def parse_year_month(my_date_str):
    """Param my_date_str (str) : a date string like '2021-10-18'."""
    # take the first seven characters, like "2021-10"
    return my_date_str[0:7]

assert parse_year_month("2050-01-30") == "2050-01"
prices_df["year_month"] = prices_df["timestamp"].apply(parse_year_month)

prices_df[["timestamp", "year_month"]]
timestamp year_month
0 2021-10-18 2021-10
1 2021-10-15 2021-10
2 2021-10-14 2021-10
3 2021-10-13 2021-10
4 2021-10-12 2021-10
... ... ...
95 2021-06-03 2021-06
96 2021-06-02 2021-06
97 2021-06-01 2021-06
98 2021-05-28 2021-05
99 2021-05-27 2021-05

100 rows × 2 columns

def day_of_week(day_index):
    weekdays_map = {0: "Monday", 1: "Tuesday", 2: "Wednesday", 3: "Thursday", 4: "Friday", 5: "Saturday", 6: "Sunday"}
    return weekdays_map[day_index]

prices_df["day_of_week"] = prices_df["weekday"].apply(day_of_week)
prices_df[["timestamp", "timestamp_dt", "year_month", "year", "month", "weekday", "day_of_week"]]

However, for date and time specific values, it can be helpful to use the to_datetime function to make life easier.

After passing a column of date strings into the to_datetime function, we obtain a datetime-aware column that respects datetime operations.

print(type(prices_df["timestamp"][0]))
<class 'str'>
from pandas import to_datetime

prices_df["timestamp_dt"] = to_datetime(prices_df["timestamp"])

print(type(prices_df["timestamp_dt"][0]))
<class 'pandas._libs.tslibs.timestamps.Timestamp'>

This allows us to easily convert and transform those values to various component date parts, such as just the year, just the month, etc.:

prices_df["year"] = prices_df["timestamp_dt"].dt.year
prices_df["month"] = prices_df["timestamp_dt"].dt.month
prices_df["weekday"] = prices_df["timestamp_dt"].dt.weekday
prices_df["day_name"] = prices_df["timestamp_dt"].dt.strftime("%A")

prices_df[["timestamp", "timestamp_dt", "year_month", "year", "month", "weekday", "day_name"]]
timestamp timestamp_dt year_month year month weekday day_name
0 2021-10-18 2021-10-18 2021-10 2021 10 0 Monday
1 2021-10-15 2021-10-15 2021-10 2021 10 4 Friday
2 2021-10-14 2021-10-14 2021-10 2021 10 3 Thursday
3 2021-10-13 2021-10-13 2021-10 2021 10 2 Wednesday
4 2021-10-12 2021-10-12 2021-10 2021 10 1 Tuesday
... ... ... ... ... ... ... ...
95 2021-06-03 2021-06-03 2021-06 2021 6 3 Thursday
96 2021-06-02 2021-06-02 2021-06 2021 6 2 Wednesday
97 2021-06-01 2021-06-01 2021-06 2021 6 1 Tuesday
98 2021-05-28 2021-05-28 2021-05 2021 5 4 Friday
99 2021-05-27 2021-05-27 2021-05 2021 5 3 Thursday

100 rows × 7 columns

For more information about date and time conversions, see the following documentation links: